
Managing multiple store locations can be tricky, especially when trying to understand how customers move through each space. Foot traffic analytics and heat map technology make this easier by providing clear insights into foot traffic patterns. This allows businesses to adjust layouts, improve product placement, and streamline operations.
Let’s examine how heat maps can help you make better decisions and boost your store’s performance. They show you where customers spend their time, which is gold for any retailer.
Understanding Customer Movement with Heat Maps
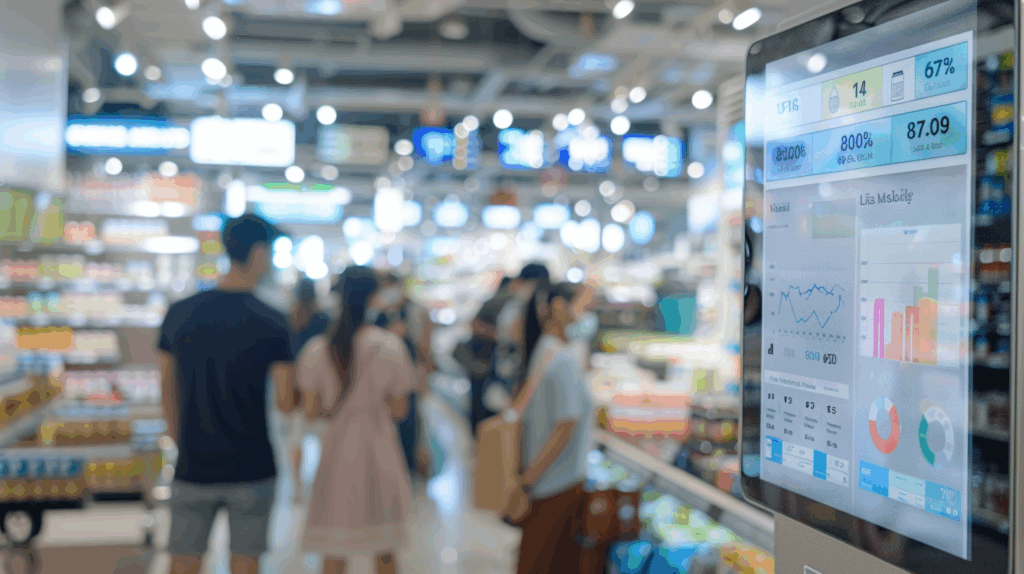
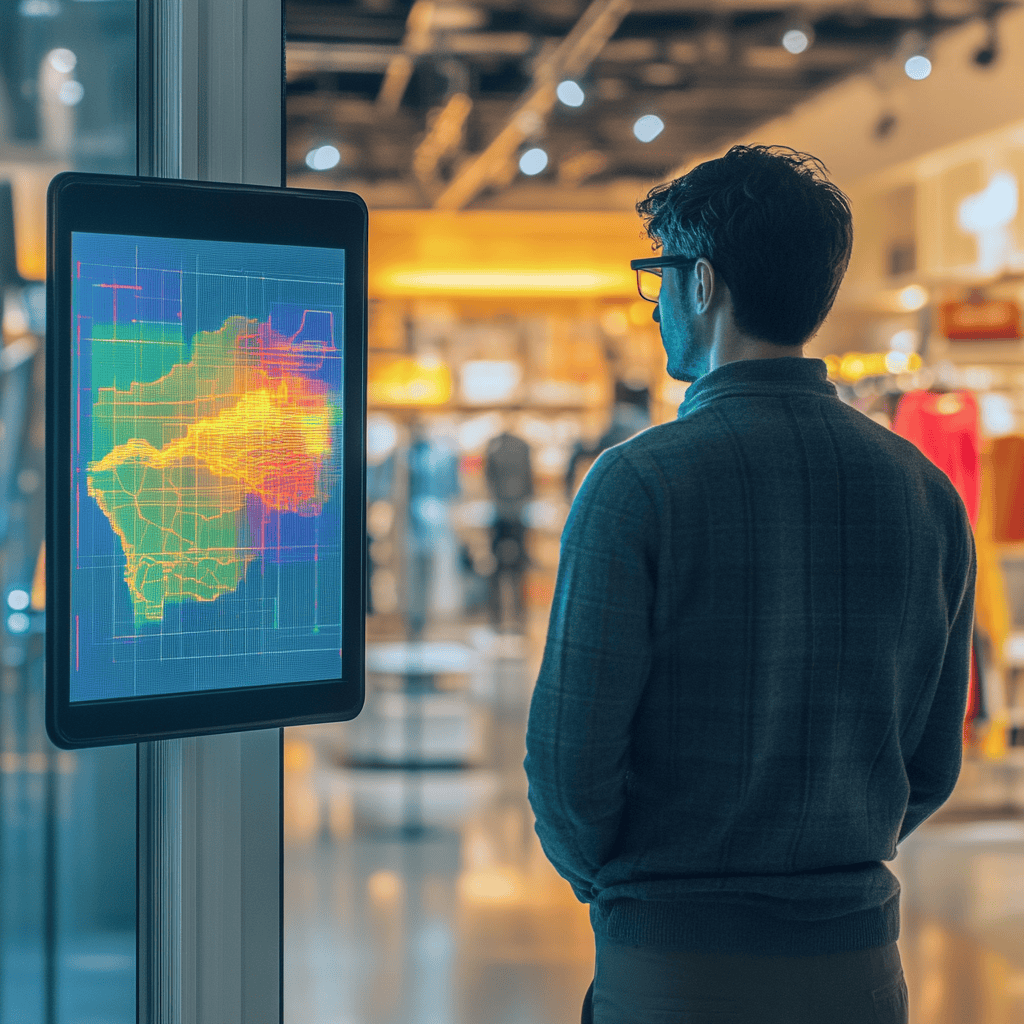
Heat maps are a valuable tool for businesses with multiple locations. With this technology, you can see exactly where your customers spend their time. Heat maps use real-time monitoring to track foot traffic data collected across your stores, helping you understand customer behavior more accurately than traditional methods.
In-store heat maps can highlight “hot zones” where customers spend the most time, giving insights into which products or displays work. On the other hand, they can also reveal “cold zones”—areas that are being ignored. This real-time data can help you quickly adapt your store layout and make informed decisions on what changes will drive more sales.
Multi-Location Insights
If you manage multiple locations, you know the pain of comparing performance across the board. Foot traffic analysis lets you view foot traffic data and compare trends between store locations. You can pinpoint where performance dips and address issues by overlaying a heat map across your business network.
For example, a location in a high-traffic urban area might see a different customer behavior pattern than a suburban store. By looking at store performance through the lens of foot traffic data, you can optimize how each store operates. This is especially helpful for identifying trends in customer movement, product placement, and even employee productivity.
How Heat Maps Drive Operational Efficiency

Heat maps provide vital metrics that help you improve operational efficiency. Real-time data collection from heat maps can show how quickly customers move through different areas of your store, where bottlenecks happen, and even which products catch their attention.
For instance, if certain areas consistently see high footfall data, but sales don’t reflect that traffic, it could indicate a mismatch between customer interest and product placement. Using this data, you can test different layouts and products in those areas to see what clicks with your audience.
Foot traffic data can also boost operational efficiency by monitoring and adjusting employee activity. With real-time monitoring tools, you can schedule staff more effectively, ensuring that high-traffic areas are always covered while avoiding overstaffing in slower spots.
Real-Time Monitoring: The Heart of Heat Map Technology
Real-time monitoring is essential for businesses looking to stay competitive. The ability to track and respond to foot traffic in real time helps companies make quick, data-driven decisions. It’s not just about tracking customer flow—it also involves establishing secure connections between monitoring agents and tools to ensure the data is accurate and reliable.
Heat maps enable real-time data collection by continuously updating customer movement patterns across store locations. This ensures you’re always ahead of the curve when adjusting. Real-time monitoring software also allows businesses to collect data from mobile devices and other sources, providing mobility data and mobile location data. This level of detail offers insights into where customers are and how they move. If a display isn’t working or a store section is underperforming, you can quickly respond by adjusting product placement or staffing levels. Well-defined response procedures ensure that these tweaks are implemented efficiently.
Leveraging Data from Multiple Sources
Heat map technology doesn’t operate in a vacuum. It pulls from various data sources to create a complete picture of customer behavior. Display monitoring data, demographic data, and network traffic are key elements that enhance the overall accuracy of the insights generated. By integrating these data points, businesses can better understand customer patterns and adapt quickly to shifting needs.
Demographic data allows retailers to segment their customer base, tailoring store layouts to specific groups. Meanwhile, tracking network traffic and monitoring how customers interact with store Wi-Fi or digital kiosks provide another layer of insight into foot traffic. These data sources contribute to identifying key metrics that help improve store layouts, refine product placements, and enhance customer experiences. This holistic approach ensures that decisions are based on reliable data, leading to more effective business outcomes.
Improving Store Layouts with Data Visualization
Optimizing store layouts is crucial for maximizing customer satisfaction and sales. This helps when making data-driven decisions about where to place high-margin products or which items need more visibility. Products with a high sell-through rate can be better placed in highly trafficked areas, while those with a low sell-through rate can be moved to different spots or marked down.
You can also use heat maps to analyze product placement regarding pricing. If a $50 item sits next to a $10 one, it can confuse customers and slow down their decision-making process. The heat map data helps you balance collections by price, ensuring that products are presented in a way that encourages quicker purchases.
Data-Driven Insights for Smarter Decisions
One of the most valuable aspects of heat mapping is its ability to generate insights from the data collected. Whether it’s mobility, demographic, or location data, you can use these insights to make smarter decisions that directly impact your bottom line.
Retailers that use data insights effectively can see improvements in employee productivity, store performance, and overall business operations. From reducing wait times to improving product placement, the right tools can turn a flood of customer data into actionable steps that create tangible results.
Key Benefits of Heat Maps for Multi-Location Businesses
Managing multiple store locations requires reliable data to ensure each location performs at its best. Heat maps offer many advantages for businesses with a wide footprint. First, they provide the most accurate method for tracking customer movement, eliminating guesswork from your operational decisions. Second, they help businesses identify opportunities for cost savings by pinpointing inefficiencies in layout and staffing.
If one location consistently underperforms, heat map data can reveal whether the issue is related to foot traffic patterns, product placement, or employee engagement. Businesses can optimize their operations and improve store performance by addressing these issues based on solid data.
Final Thoughts
Heat map technology is a powerful tool for visualizing customer flow and improving operational efficiency, especially for businesses with multiple locations. By integrating real-time monitoring, data insights, and foot traffic analytics, you can fine-tune your store layouts, increase sales, and provide a better shopping experience for your customers.
With heat maps, you can see where people go in your store, so you’re not just making wild guesses—you’re using real information to improve your business.